
12/31/2021 by Jerry Nix, Freewavemaker, LLC
A HISTORICAL PERSPECTIVE:
Had we met a little over 19 years ago and you had about $100,000 to invest – I may have recommended the following investments to you. At that time, many of these names were unheard of to many people. When you see the prices that you would have paid for these stocks, please keep in mind these are the split adjusted prices.
For example: Apple Computer has split a couple of times since this portfolio was put together. There was a 7:1 split on June 9, 2014 and another 4:1 split on August 31, 2020.
With $100,000 to invest I may have recommended that you invest approximately 90% of the amount in stocks (equally weighted) while holding 10% in cash. Cash was actually paying a return in excess of 1.6% back then which is about 3X greater than it is today. However, the numbers you see below will not include this return, nor will it include the return through the use of dividends paid by these various companies (some pay them and some don’t – or have not paid them for the entire period). What you will see is simply the change in “share value.”
The stocks and the prices you would have paid back then may have been as follows on the investment start date of 09/20/2002:
| Company | Symbol | Shares Purchased | Price per Share | Amount Invested |
| Qualcomm Inc | QCOM | 1,018 | $14.04 | $14,285.70 |
| F5 Networks | FFIV | 2,901 | $4.92 | $14,285.70 |
| Skyworks Soltn | SWKS | 3,175 | $4.50 | $14,285.70 |
| Cirrus Logic | CRUS | 5,580 | $2.56 | $14,285.72 |
| American Tower | AMT | 7,326 | $1.95 | $14,285.72 |
| Apple Inc | AAPL | 53,799 | $0.27 | $14,285.55 |
| Total Invested | $85,714.09 |
Remainder in cash = $14,285.91
IT SHOULD BE NOTED: I actually put this portfolio together for a client in 2008 at the height of the recession to ward off fears of a devastating stock market. I was trying to convince this client that he was correct in not selling off his securities simply because there was a “hiccup” in the market that caused it to trend down for a couple of years. He had plenty of years for the market to turn around before his retirement.
BULL AND BEAR MARKETS:
Good investors know that markets will not always be on a bull run going straight up. There will be down turns (known as bear markets) as shown in the graphic below:
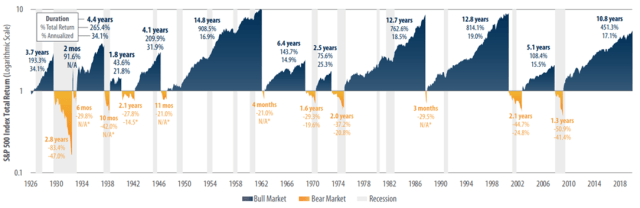
You will notice in the above graphic the Bull Markets in Blue and the Bear Markets in Orange from 1926 through 2018. Over this 93-year period there have been 79 years of Bull Markets with an average lifespan of 6.6 years. There have been about 14 years of Bear Markets with an average lifespan of 1.25 years. So, Bull Markets far outweigh the Bear Markets.
BEAR MARKETS though, are hard for most people who are heavily invested to deal with.
FOR EXAMPLE: In the last bear market shown on the above graph (approximately from October 2007 through March 2009) this portfolio would have gone from a value of $945,248 to $506,340 – a decline of about $438,908 of about 46%. Still higher than what was invested … but many people would have sold out after taking that first roller coaster ride. They would have been sorry, too! You can view a full chart of this portfolio later in this article.
INVESTMENTS DO GO UP AND DOWN:
Investments will go up and down in value regardless of whether we are in a bull market or not. In this portfolio by 09/20/2021, it had grown to a value of $2,816,835 and within just 9 months later (in a BULL MARKET) the value was $1,784,653 06/26/2013. That would have been a decline of over $1,032,000 or about 36.64%. Again – many people would have sold out and moved on.
By August 31, 2018 the portfolio had grown to a value of $5,321,915 … we were still in a Bull Market … and by January 4, 2019 (just 5 months down the road) the portfolio was down to a value of $4,071,029. Again another $1,250,000 decline in value in a short period of time.
Swing Traders love to talk about buying on the dip and selling at the peak. The only problem with that theory is it is awfully hard to know when the dip has dipped as low as it can go or when the peak has peaked as high as it can go … unless you have a “crystal ball” that most of us do not have. There are a few statistical tools that can help … but you have to be a stock analyst to understand most of them.
If you decide to swing trade issues such as these it would be a good idea to wait for follow through at the PEAK before getting out and follow through at the DIP before getting in. Follow through is not a one-day price gain or loss. I would recommend waiting for 3 to 5 days of price gains or losses. Or you could simply use Stop Loss Orders to sell out and Limit Orders to buy in.
However, this article is intended to show the benefits of Buying and Holding investments in quality companies.
FORCES THAT MOVE THE MARKET AND INDIVIDUAL STOCKS:
There are many forces that can move individual securities or the market in general as a whole.
Here are a few things that can move individual stocks/securities (this is not a full list of things):
- Earnings (good causes stocks to rise, bad causes stocks to fall).
- Press releases (weed out the noise since much of them today are fake reports anyhow).
- Lawsuits against the company (example Johnson & Johnson Talcum Powder lawsuit).
- Mergers and Acquisitions.
- Even divorce of the CEO (Especially if the CEO happens to be the company founder).
Here are a few things that can move the entire market (again this is not a full list):
- Bad economy or good economy causing bad or good earnings for many companies.
- Interest rates.
- Inflation.
- Wars and rumors of war.
- Bad or fake press put out by the “Fake Media.”
- Pandemics and Rumors of Pandemics.
However, the biggest mover of markets is FEAR and GREED of consumers and investors. That’s right – two illogical emotions control most of the market direction.
When people are fearful and hoarding their money (not spending or investing) markets tend to pull back. When people are greedy and their money is “burning a hole in their pocket” markets tend to advance.
There is a FEAR GAUGE known as the S&P Volatility Index or VIX. Check out the chart below and notice that when the VIX goes up (people are fearful) the S&P 500 tends to fall lower … and when the VIX goes down (people are no longer fearful) the S&P 500 index tends to trend higher.

Every time over the past five years that the Red Line (VIX) has increased, the Green Line (SPX) has come down. That’s the only Crystal Ball I can offer you. But look at the long-term trend of the green line … the S&P 500 Index. It’s up about 115% or so over the past five years whereas the VIX is up only 25% – though it’s been as high as 370% for a short period.
BACK TO OUR BUY AND HOLD PORTFOLIO:
By February 19, 2020 the portfolio that was purchased in 2002 was worth $7,841,744. Then we got hit by either a pandemic or a rumor of a pandemic known as Covid-19. By March 20, 2020 the portfolio of stocks dropped to a drastic low value of just $3,114,789.
That would have been a loss of $4,726,955 or 60.3% or so, in a period of 1-month. How many of you would have sold? How many of you would have bought more (if you had the money to do so)?
I mean, after all, had you sold on March 20, 2020 when it looked like all hell had broken lose and the country was headed for the basement along with some of our political leaders we now have, you would still have come out with gains of $3,014,788 for a holding period of about 18 years … that’s still a whopping return on investment (ROI) of 3,014.8% when it’s all said and done.
HOWEVER, had you held on, this is what your portfolio would look like today:

If you add up the market value (last column to the right) it would add up to $13,618,728.36. Add your cash to that and your total market value would be $13,633,014.27. Your total return would have been $13,533,014.27 after deducting cost of $100,000 for a total ROI of 13,533% over a period of about 19 years.
What would have been the annual compounded rate of return on this investment portfolio? For that we must go to a computer. Here’s the calculations:

The long-term annual compounded rate of return on this investment portfolio would have been 28.971% per year. Here’s the table of values had you gotten this return each and every year (compounded annually):

Since you would not be able to get that return consistently every year in the stock market, this is what your account would look like on a day-to-day basis:

SUMMARY:
If you have time on your side (five years or more), quality stocks that should perform well in most up markets, and refuse to look at your portfolio every minute of every day – there is probably no reason to get out of those stocks just because the market may trend down for a year or two. Remember the Bear Markets are way outnumbered by Bull Markets, and the average length of a Bear Market is only 15 months as compared to the average length of a bull market at about 79 to 80 months.
Stop listening to the knuckleheads on the various TV shows that say you should not be in the market. Start looking at your portfolio and thinking about it logically and not emotionally. Don’t worry about who is the US President and who is not. The market does not care – and I have written an article Does The Market Care Who’s President? that you can get by following the link. Stay diversified and stay informed … but remember as you get information to “weed out the noise.”
You are going to make mistakes … learn from them and don’t repeat them. Success is not about the destination … it’s about the journey. It’s about failing and rising up from the failures to proceed to victory.
Lay out an investment plan in writing before acting on one. Make sure you have entry as well as exit strategies in place – and don’t change investments for the sake of changing investments. When and if you do sell an investment … do so only when you have another investment to put in its place. Keep cash as low as you can at all times since it currently does not pay a lot – even with rising interest rates and inflation. Remember if you’re getting 2% on cash and paying out 6% on inflation (not to even consider taxes) you are losing 4% per year – and you won’t get rich like that.
I have various portfolios … some for short-term gains (such as stock options) and some as long-term buy and hold investments using quality stocks and Exchange Traded Funds. Given enough money (e.g., $50,000 or more) there is likely no reason to have it all in one portfolio – especially if you have varying investment objectives with various amounts of money.
That’s all I have for you on this New Year’s Eve – 2021. Here’s wishing you the very best in 2022! Will next year be a good year or bad year for stocks? I have no idea … but I can tell you I will be investing in the stock market as always, because even if it is a bad year … it won’t be bad long and it will provide me with Opportunity. If you want to be lucky all you have to do is remember that Luck is when Preparation and Opportunity meet up and Action is taken.
So go into 2022 Expecting the Best, Anticipating the Worst, and set on Capitalizing on whatever comes your way.
Happy New Year!
Another great article I can understand, Happy New Year
Thanks Jim. I appreciate your reading my articles and am glad to still be able to help you with clients from time to time.
Dick, thanks for reading the article. I have just published another I think you will also like about rising interest rates. Also, I hope this finds you and Rose doing good. Wish you could make the motorcycle trip in May – gonna miss you there again. It looks like Cedric is in for sure since he has paid about 30% of the entire cost (non-refundable). Have a great weekend my friend and don’t work too hard on that house in the blinding snow you must be getting by now.
Excellent as always big bubba. Great information I will use to help nervous clients stay the course
It’s always a pleasure to read your articles. 15 years ago I had 85k to invest, and thought I invested wisely, today I still have 85k??? Just never could get ahead of the market changes.
Dennis … I’ve learned as I’ve grown older that we sometimes are too quick to jump out of one investment into another for the sake of greed or fear. Those are the two emotions that drive us and the markets. I once had a client that owned 20 stocks … he never purchased any other companies but those 20. He would accumulate his dividends for a year and invest at the end of the year in whichever stock in his basket performed the worst for that year. He would also never by a stock that did not pay at least 1% in dividends. Ole Clyde died at age 95 a very rich man and still held the same 20 stocks that he’d held for years – but his account was much larger than it had ever been. He did not make a lot of money each year … but he never lost a lot either. He was happy with his 7 to 8% per year increase in value (on average) because after all … that is more than the bank was willing to pay him. There are 10 major stock sectors in the S&P 500. Pick a couple of stocks from each sector that pays dividends and has a history of increasing those dividends long-term and invest there. You could either reinvest the dividends … or hold them for a year and invest in the worst performer for the year. Another option would be to simply invest evenly in the Sector ETFs known as the Spiders. If your interested in them I can send you a list of them. My wife has 7 of these (with some index ETFs mixed in) and she is up 42.77% in the past two years. Not great … but not bad either. I hope this has been helpful.