
Summary of this article: To explain the difference in various investment strategies such as …
- Buy and Hold
- Dollar Cost Averaging
- Buying on the Dips, and
- Swing Trading
What does one mean when they say Buy and Hold?
It normally means that once they invest in Stocks, ETFs or Mutual Funds they are going to hold them for a long period of time (e.g. 5, 10, 20 or more years) regardless of price swings. You will see some of that in the article as I describe other strategies starting with Dollar Cost Averaging.
What is Dollar Cost Averaging?
It is an investment technique that involves buying a fixed dollar amount of a particular investment on a regular schedule over time. By doing this, the investor ends up buying more shares when prices are low and less shares when prices are high. Dollar cost averaging should not be confused with “Buying on the Dips” or “Swing Trading” which will also be touched on in this article.
First let’s review a Hypothetical Sample to get the feel of it:
Here it is as a story I used to tell my clients when I was trying to get them to make monthly investments toward a long-term retirement or education funding goal.
Mr. Client and Mrs. Client both have $12,000 to invest for the future. Mr. Client thinks he knows everything about the investment fund or stock he wants to buy and feels that it is at a low right now. Therefore he puts his entire $12,000 to work all at one time. Mrs. Client, on the other hand, is somewhat more conservative than Mr. Client … and although she also believes the investment will appreciate in time she has decided that it can also go up and down over time. Therefore, she is going to play it a little safer and only invest $1,000 per month until she has invested the $10,000.
Look at the table and graphs below for the values and investment of Mr. Client:

We can clearly see that Mr. Client invested his whole nest egg in the first month. Now since we don’t have a crystal ball there is no way to know that he could have set out a month or two and gotten a better price … or even set out 10 months and gotten a heck of a deal. All indications were when he made the investment that $10 was a fair price to pay for the shares of the stock. Look at his value chart:

What a roller coaster ride … I’d say by the third month Mr. Client was feeling some anxiety and by the 10th month, if he did not have bleeding ulcers, he at least had some sleepless nights and heartburn. Look at the next chart that adds in his investment:

By the 12th month Mr. Client was back to even and in most cases if he is like the few that did not sell when he’d lost 50% of his investment by the 3rd Month or 85% of his investment by the 10th month (about 90% of investors I know would have sold) – he would likely sell when he broke even and put the proceeds back in the bank to earn a measly 0.50% or less.
Now let’s take a look at the table and graphs below for the values and investment of Mrs. Client, the smart one in the family (and believe me when I told this story to clients the wife loved being called the “smart one in the family” and the husbands just laughed it off):

Since you cannot buy fractional shares of a stock or ETF, but you can a mutual fund, I chose to round the shares off to the nearest whole number for each purchase. Thus, if you tried to divide $1,000 by $7.00 (the second month) you would come up with 142.8571 shares … I rounded to 143. Since some numbers are rounded up and some are rounded down it will be close.
We see here that Mrs. Client invested the same amount of money ($12,000) over 12 periods (it does not matter if months or years) and bought various amounts of shares at various costs. Let’s take a look at her value graph:

You can see there was a downturn in value in periods 8, 9 and 10 — Dollar Cost Averaging does not guarantee a gain in value at anytime. Now look at the same chart with her investments added:

You can see here that even though there was a downturn in periods 8, 9 and 10 she still pretty much maintained a higher value than she did costs in all other periods. While Mr. Client was “below water” for all 12 periods (or even on the first and last period), Ms. Client only was below water for 3 of 12 periods – a win ratio of 75%.
There is a difference between Average Price of Stock and Average Cost of Stock:
In Mr. Client’s scenario he had the same average cost and average price of stock since he actually made an investment in a lump sum amount. His price at time of investment was $10.00 per share and his cost at that time was $10.00 per share.
Mrs. Client on the other hand if you consider the various prices of stocks (shown below) had a difference between average price and average cost as follows:

Anytime you can keep the average cost you pay below the average price … you will likely make some money – though there is never a guarantee, especially if you sell early. Had Mrs. Client sold in the 8th, 9th or 10th period she, too, would have lost a little money. The price you sell at must be higher than your average cost at the time you sell the investment.
So, that is the essence of Dollar Cost Averaging … investing a consistent amount of money over a period of time rather than investing a large lump sum all at one time.
So, what does one mean when they say “Buying On the Dips?”
This means that you basically buy when the stock or ETF share price has fallen below your previous purchase. A good way to look at this is to look at a specific stock. In this example I will use weekly prices on Apple Corporation (AAPL) from 11/23/2015 through 11/19/2018. The chart below shows closing prices on every Monday (assuming Monday was not a holiday). I have put small arrows on dates that I would consider (looking back in time where hindsight is 20/20) that a person may consider buying more shares after the initial purchase:

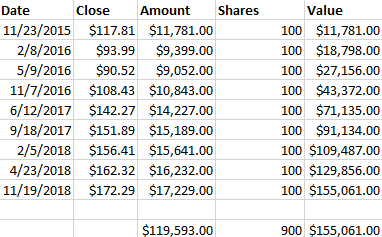
Now had an investor originally invested in 900 shares of this stock at the close of business on 11/23/2015 when the stock was selling for $117.81 this is what his ledger would look like on each of the dates shown with the yellow arrows above (again, this might be what Mr. Investor would do):

As you can see here, if the investor would have bought the 900 shares on 11/23/2015 and simply held them through 11/19/2018 his/her $106,029 initial investment would be worth $155,061 on that date. But, as Figure 8 shows … the investment had a value of about $227.63 per share at the close of business on 08/27/2018 which means the 900 shares was worth as much as $204,867 back then. Now the chart that goes with Figure 9 (Figure 10) does not show the dip that you see in Figure 8 because it only represents values on the dates shown in Figure 9:

This is what your investment would look like had you bought and held it and only looked at it on the dates represented in Figure 8. Naturally there would have been more ups and downs during the time period shown.
Now let’s see what would happen if you only decided to purchase 100 shares at the beginning of the period and another 100 shares each time the stock dipped (as represented by the yellow arrows in Figure 8). Assuming this is for Mrs. Investor, this is what her investment ledger would look like:
As you can see, she would actually invest about $13,564 more money to end up with the same number of shares and the same $155,000 … but look at the equity line of the investment over time:

You can see here, it does appear that “buying the dips” can smooth out some of the volatility in certain investments – though it is not guaranteed to do so.
Let’s take a look at doing the same thing on another stock just to see if this really does work. In this example I am using Procter and Gamble (PG). Look at this five year weekly chart from 11/25/2012 through 11/19/2018. Again, the yellow arrows signify buying on the dips.

Had an investor with about $84,220 laying around, wanting to make a solid investment, he or she could have purchased 1,000 shares of this stock on 11/25/2012. Again, we will call this guy Mr. Investor. This is what his “investment ledger” would look like over the term:

And, this is what his “equity line” would look like assuming only the dates shown in the ledger:

So, if he sold on 11/19/2018 he would have netted proceeds (not counting commissions) of $91,540 for a gain of about $7,320 over the five year period.
Now let’s assume his wife, Mrs. Investor decided to invest in the same stock but rather than put the money all in at one time she decided to invest only about $10,500 (rounded to the nearest whole shares) until the money was all in. She also decided to be patient and invest only on dips after her initial investment. This is what her investment ledger would look like showing the same dates as we showed for Mr. Investors ledger:

You see here she invested close to $84,220 – though not exact – and was able to purchase 54 more shares for 1,054 total.
Now let’s look at her “equity line” over the period:

As you can see, while there were some dips in the “equity line” for Mrs. Investor, there were far fewer and much more reduced as compared to Mr. Investor shown in figure 15 with a definite trend up over time.
That is Buying on the Dips!
What, then, is Swing Trading?
Swing trading is a type of trading style that focuses on profiting off changing trends in price action over relatively short timeframes. Swing traders will try to capture upswings and downswings in stock prices. Positions are typically held for one to six days, although some may last as long as a few weeks if the trade remains profitable.
For purposes of this article I am going to be discussing a “modified” swing trading strategy. While most swing traders would by a stock going up and sell it short when going down … I am going to leave the “short-selling” alone for now and simply sell the stock when it is profitable and buy it back when it has corrected. I call this strategy, “Never Falling In Love With Your Stock.”
Let us assume that Mr. Investor wanted to purchase shares 200 shares of PG on 01/27/2014 when he thought it was a fair price that he intended to hold forever. We, of course, know in hindsight that this would not be a brilliant move simply based on this stock ledger below:

As you can see in the ledger (Figure 18) and the graph below (Figure 19) the stock did trend up for a while but then it did fell back again, just to trend up again, just to correct again, and start to make gains again.

The bottom line: This buy and hold strategy (when dividends are not included and not considering commissions) led to $15,848 becoming $18,764 over a period of 4.8 years. That’s a gain of about $2,916 that it took more than 4 years to acquire.
Take a look again at the graph below on PG and pay attention to the Red Arrows and Green Arrows:

This graph shows the weekly prices since December 31, 2013 and through November 19, 2018 at each Monday’s close. The red arrows indicate a good time to purchase the stock and the green arrows indicate a good time to consider selling the stock.
Let’s assume that Mrs. Investor – who found it hard to fall in love with Mr. Investor – also finds it hard to fall in love with a stock. Therefore, she decides in advance that she will buy when she feels the stock is low, sell when she feels it is high and could go lower and buy it again with full proceeds from the previous sale when she feels it is once again low enough to buy. If you ran this chart on a daily basis you would likely come up with higher highs and lower lows that is shown here. However, you need to understand that you are never going to catch a stock at its ultimate low to buy it or sell it at it’s ultimate high to profit. Thus, to keep it simple and less confusing, I’ve chose to use a weekly chart. Look at Figure 21, the investment ledger for Mrs. Investor:

You will notice this table shows the buys in Red (money out of the account to purchase the stock) and the sells in Green (money in the account due to proceeds from selling the stock).
In the first period (01/27/2014 – 05/05/14) Mrs. Investor made a profit of $630 and was sitting on proceeds of $16,478 and 0 shares once she sold the stock. She waited until the stock dropped to $80.06 per share and was able to purchase 206 shares instead of the original 200 shares … now owning 6 more shares than Mr. Investor.
By continuing this trend over the 4.8 years she was able to buy and sell the stock 10 times ending up with a total of 465 shares that she could sell for $43,612.54 turning a profit of $27,764.54 in the same period of time that Mr. Investor was able to turn a profit of just $2,916. So in short she was able to almost triple her money and almost profited 10 times the amount Mr. Investor profited.
Here’s a snapshot of her “equity line.”

Now that is a nice “equity line” with no draw down since the stock was sold at higher prices than it was purchased for and the cash was held until the next purchase. I warn you; this is easy to write about but not so easy to do in practice.
If you are going to attempt swing trading I strongly recommend that you seek the advice of a professional, that you learn to do some research on the stock you want to purchase, that you watch earnings and other news releases on the stock and most importantly that you have an “entrance” and “exit” strategy in place before purchasing and/or selling. In addition you really need to understand how much commissions, if too high, can destroy your overall returns. Remember, I am showing all of this with no commissions calculated in.
Will Dollar Cost Averaging, Buying the Dips, or Swing Trading assure a better return then Buying and Holding?
Not necessarily. Take a look at the following Dollar Cost Averaging strategy using Johnson & Johnson (JNJ).
Assume Sister Wave-Maker and Brother Wave-Maker each received $105,000 in an inheritance from rich and famous Uncle Wave-Maker, and both decided to purchase shares of JNJ. Brother Wave-Maker, the egocentric man, will invest all at one time while Sister Wave-maker, the patient one, will simply invest about $5,000 per quarter for 21 quarters. Look at these two investment ledgers and the following investment graphs:


As you can see, in this scenario, Brother Wave-Maker ended up with more money ($156,142) than Sister Wave-Maker ($134,059.56) – and they both invested $105,000. Because Sister Wave-Maker made her investments at various costs over a 21 quarter period at $5,000 per quarter – she was only able to purchase 944 shares as compared to Brother Wave-Maker’s 1,100 shares.
However, there are two things to notice here:
- Brother Wave-Maker’s overall annualized rate of return was 8% while Sister Wave-Maker earned an annualized rate of return of 9.48%. Remember, she did not have all her money working for the entire 21 quarter period like Brother Wave-Maker did. She only had $5,000 working for the entire period and the remainder of the purchases worked for less time.
- By looking at the graphs, you can see that the overall volatility (up and down movement of the investment) was lower for Sister Wave-Maker than it was for Brother Wave-Maker.
Takeaways from this Article:
Consider other strategies when Buy and Hold does not seem to be working as you thought it should. Never fall in love with an investment you’ve made even if you are a buy and hold investor.
Do not try to time the market as it has never been done with 100% accuracy, but understand there is nothing wrong with buying a stock or other equity investment when it is low and selling it when it is high regardless of how long you have held it.
Make sure you have both an entry and an exit strategy in place. This may be nothing more than using limit orders to purchase and stop loss orders to sell. There will be more on this in an upcoming article – but for now – have a plan and stick to the plan without emotion in your actions.
Consider diversification by not only holding several different investments but also by diversifying your buys and sells over time rather than betting the farm on a few holdings in hopes that they will go up in value.
When in doubt, talk to a person who makes his/her living by helping people with investment strategies.
Disclaimer:
This information is not recommendations for you to purchase or sell any investments outlined in this article. The information is being shared for educational purposes only. I recommend that you seek the advice of a licensed and competent financial advisor before taking actions on your portfolio if you see a need to after reading this article.
The author of this article holds the following investments outlined herein: Apple Stock and Options, Procter and Gamble Options and Johnson & Johnson stock.
Thank you,
Jerry Nix, Freewavemaker, LLC