
Note from the Author:  I have previously posted a blog which was Part 1
of this continuing blog. You can read that blog by clicking on this link
if you care too.
Under the separation of powers created by the United States Constitution, the United States Congress has the sole power of the purse and responsibility for appropriating government funds. Like other bills, appropriations must be passed by both the House of Representatives and the Senate. Upon passage of a final version by both houses, they go to the President of the United States. If the President signs the bills, they become law. If instead the President vetoes them, they go back to Congress, where the veto can (in rare instances) be overridden by a two-thirds vote of both houses.
Government shutdowns tend to occur when the President and one or both of the chambers of Congress are unable to resolve disagreements over budget allocations before the existing budget cycle ends.
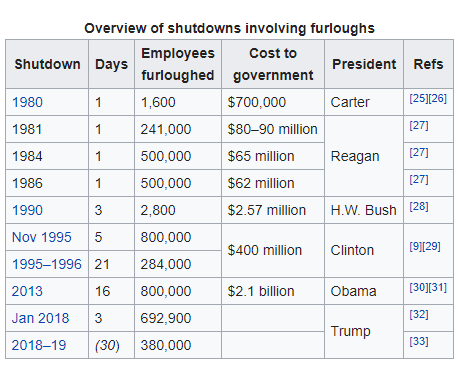
Initially, many federal agencies continued to operate during shutdowns, while minimizing all nonessential operations and obligations, believing that Congress did not intend that agencies close down while waiting for the enactment of annual appropriations acts or temporary appropriations. In 1980 and 1981, however, Attorney General Benjamin Civiletti issued two opinions that more strictly interpreted the Antideficiency Act in the context of a funding gap, along with its exceptions. The opinions stated that, with some exceptions, the head of an agency could avoid violating the Act only by suspending the agency’s operations until the enactment of an appropriation. In the absence of appropriations, exceptions would be allowed only when there is some reasonable and articulable connection between the function to be performed and the safety of human life or the protection of property. However, even after the Civiletti opinions, not all funding gaps led to shutdowns. Of the nine funding gaps between 1980 and 1990, only four led to furloughs.
Source: Link Here
It is interesting to me that the Media keeps touting that 800,000 have been furloughed without pay – some do simply say 800,000 without pay – yet you look at the numbers above and it is 380,000 that have been furloughed. Whereas, when Barack Obama led the government there was 800,000 furloughed and we are not hearing a whole lot about that. When Clinton led the government there was 800,000 furloughed in 1995 and 284,000 furloughed in 1996. When Reagan led the government he had three shutdowns and why they even consider Bush and Carter’s a shutdown I have no idea.
In the 20 previous shutdowns going back to 1976, stock prices have rarely moved significantly lower and in fact, they have posted a flat median return during the government closures, according to data from LPL Financial Research.
“Although shutdowns get a lot of media hype, the reality is that stocks tend to take them in stride. In fact, the S&P 500 has gained during each of the five previous shutdowns,” said Ryan Detrick, LPL’s senior market strategist.

Source: Link Here
Weeks before this latest shutdown, Marketwatch.com reported on this issue and stated that a short shut down would have little, if any, effect on the market or the economy. But the article states “this all depends on just how long the shutdown lasts. Longer shutdowns have typically resulted in more pronounced declines in the S&P with exception of the 21-day event in 1995.”
Source: Link Here
In my last article on this subject that was published on January 11, 2019 – this is what I had to say:
“So, as you can see, it appears the stock market likes having the government shutdown. I don’t know if this trend will continue in the market … but I also don’t think the government is going to stay shutdown much longer. Either congress is going to give in and give President Trump the money for the wall on our southern border or President Trump is going to declare a state of emergency and get the funding from the military budget, which could be replaced easily with the additional revenue being generated by the new trade agreement between Mexico and the United States of America.”
As of today the government has been on a partial shutdown for 30 calendar days. As of the close of business Friday night (01/18/2019) this is how the three main indices of the stock market have performed since December 21, 2018 when the government (our elected clowns) decided a war between the executive branch and the legislative branch is what is best for the country at this time.

As you can see the Dow Jones Industrial Average is up about 10.07% (Red Line). The S&P 500 is up about 10.51% (Green Line). The NASDAQ Composite (White Line) is up about 13.02% just in the past 30 calendar days or 18 Trading Days.
Now when we look at the returns for a daily average and a potential annualized basis this is the sort of things we can see:

Now do I really believe the market is going to return 122% to 264% this year? No I do not! However, I do know that it has returned an average of 0.34% and and 0.73% per day – depending on whether you use 30 calendar days to calculate return or trading days to calculate return – since the government shut down.
If the government stays shut down will these positive returns continue? Who knows, I certainly don’t. If the market reopens in the very near future … will it affect the returns more positively or more negatively? … again I have no idea. What I do know is that Mr. Market is going to do exactly what he thinks he needs to do. Presidential “sneezes” and congressional “coughs” may influence it on the short term … but long-term, as long as we remain free to have a capitalistic society the market will increase in value.
Yesterday I was having coffee with a good friend (we play golf, shoot our guns, and invest together) and he asked me, “a few months ago you told me you thought the market could double in value over the next 5 or 10 years … do you still believe that? If so that means at today’s level it would have to go to about 48,000 on the Dow Jones Average.”
My answer was this: “I got into the financial services business in 1976. I started my training in December 1975 for this position. On December 31, 1975 the Dow Jones Industrial Average closed at 852.41. By December 31, 2019 … 44 years later the Dow Jones Industrial Average (DJIA) closed at 23,327.46. That means the DJIA grew by 27.37 times over the previous 44 years. Yes, I believe it can grow by 2 times over the next five years very easily and for sure by the next 10.”
Of course to grow by 2 times in five years it would have to grow by 15% per year and to grow by two times in 10 years it would have to grow by at least 7.2% per year. Not only is it possible … it could be very likely.
I don’t want to shock you out of your skin … but take a look at the following table of gains found in the Dow Jones Industrial Average (DJIA) each year for the past 9 years and 10 months. This is data taken from the weekly chart shown below:


The chart shows the ups and downs of the market that I have looked at every day for the past 10 years. I do not recommend that anyone reading this – unless you are an experienced trader – look at the market each and every day. The down times can be scary, especially when they sometimes come 4 to 5 days in a row.
The table above the chart shows that over a period of 9 years 10 months the average annual return was 15.37% per year including the down years of 2016 and so far the last ten months. This goes to prove you don’t need double digit returns every year to average a return of 15% … but it helps. It also helps to have years with very little in the way of losses. So, yes, I believe the market has a great chance of doubling over the next 5 to 10 years; especially with active money management and trading in and out of up and down markets.
Vectorvest, that currently tracks 8,086 stocks provides a daily market call. They actually have 7 different market calls depending on a person’s risk tolerance. I prefer to watch two of these … the most conservative and the most aggressive. The charts below show how these calls work.

In this chart the green and red arrows show the confirmed up and down calls … the most conservative of the Vectorvest Market Timing Calls. As you can see by the last red arrow they have had us in a down market for a period since October 4, 2018. Had you took advantage of their call … you would not have had to worry about any monetary losses since October 4th. However, the conservative call did not call for a Confirmed Up Market until this past Friday, 01/18/2019. This means that you would have missed a lot of gains since December 26th. To get a confirmed up call, the Price of the Vectorvest Composite (the average price of all stocks tracked) must be rising over a two week period AND the buy to sell ratio (measured on a scale of 0 to 2) must be above 1.
Even with the most conservative call, you can sometimes get whipsawed into losses … though usually minimal … such as what happened in April – May of 2018. You would have gotten in on an up call … and lost money before you got the down call. This goes to prove that when it comes to investing … nothing is 100% correct all the time.
Now let’s look at the more aggressive call … the Primary Wave …

Here over the same time period we see a lot more red and green arrows. This call gets you in and out of the market many more times over a given period … but that also means more commissions if you are in a commissioned account. The primary wave call would have had an investor in the market about 13 days earlier than the confirmed up call would have during this past few months.
Bottom Line: there are times to be in the market and times to be out of the market … or at least use other measures of caution such as stop loss orders or protective puts as insurance … however, the government shutting down for a few days is generally not one of the reasons. Could I be proven wrong? Over the short term … YES. Over the long-term … NO. The market will continue to rise year over year and could likely be approaching 48,000 on the DOW in the next 5 to 10 years — as long as the country stays free and we continue to have an economy that is driven by capitalist and not socialist.
I am not recommending that you get into our out of the market at this time. I am recommending having an investment plan in writing that is approved by both you and your financial advisor, if you have one, and invest according to the plan.
Have a great week,
Jerry Nix, FreeWaveMaker, LLC