
January 26, 2022
By: Jerry Nix | Freewavemaker, LLC
On January 12, 2022 I wrote the article “Buying the Indices and Technical Swing Trading Using Bollinger Bands” and promised to follow up with more technical indicator articles.

Today I want to discuss swing trading using moving averages. First let’s determine what a moving average is. It is basically the average price of the stock over a period of time (minutes, hours, days, weeks, months or years). Most traders will use days as the period; unless, of course, they are day traders then they will likely use 1-minute or 5-minute periods. It all depends, really, on the kind of chart they are using.
If they are using an intra-day chart and have it set for one-minute increments then a 20 moving average will be 20 minutes of time. If an investor is using a daily chart, then a 20 moving average will be 20 days. If it is a long-term investor using say a five-year chart on a weekly basis, then a 20 moving average will likely be 20 weeks.
Take a look at the 3 charts below:
This is a two-day chart showing the price of the QQQ Exchange Traded Fund in green and red candlesticks with the 20-minute moving average being represented by the green line.

This is a one-year daily chart showing the price of the QQQ Exchange Traded Fund in green and red candlesticks with the 20-day moving average being represented by the green line.

This is a one-year weekly chart showing the price of the QQQ Exchange Traded Fund in green and red candlesticks with the 20-week moving average being represented by the green line.

So, you see, it depends on whether you are using intra-day (minute charts) End of day (daily charts) or Weekly Charts as to how long of a period your average is calculated.
In swing trading I prefer to look at daily charts for periods of 1-month, 3-months, 6-months and a year.
However, in this article and to keep it as simple as possible, I am going to focus on a two-year time frame (daily) and only one equity – the Invesco QQQ Exchange Traded Fund. Before getting into that though … let’s look at the 3 different types of moving averages one could use.
Simple Moving Average:
A simple moving average (SMA) is an arithmetic moving average calculated by adding recent prices and then dividing that figure by the number of time periods in the calculation average. … Short-term averages respond quickly to changes in the price of the underlying security, while long-term averages are slower to react.
The most popular simple moving averages include the 10, 20, 50, 100 and 200 days. Traders often use the smaller, faster moving averages as entry triggers and the longer, slower moving averages as clear trend filters.
I personally prefer the simple moving averages because they are simple and easy to understand in my feeble frame of mine. However, there are two more to consider …
Weighted Moving Average:
A Weighted Moving Average puts more weight on recent data and less on past data. This is done by multiplying each bar’s price by a weighting factor. Because of its unique calculation, WMA will follow prices more closely than a corresponding Simple Moving Average.
Exponential Moving Average:
An exponential moving average (EMA) is a type of moving average (MA) that places a greater weight and significance on the most recent data points. The exponential moving average is also referred to as the exponentially weighted moving average. This is very similar to the Weighted Moving Average though the weight is much greater on the more recent moving average.
For a better understanding of the moving averages … and if you like being a mathematician … I recommend the following article from Investopedia.com:
As I’ve said, for purposes of this article, I am going to be using the Simple Moving Average.
Buying and Selling QQQ based on Moving Averages:
Let’s assume you have $25,000 to invest in the ETF, QQQ and you decide this is what you want to do. Take a look at the two-year chart that I have included below:
QQQ PRICE CHART ONLY …

This chart shows price only from January 27, 2020 through the date of the publication of this article. We see that the price (candlesticks) has gone from the lower left corner to the upper right corner – a nice up trend (or what I call an equity line). However, there were some times when the price was trending down for short periods of time.
Now let’s look at the same chart showing the 20-day, 50-day and 200-day Simple Moving Averages:

Again, we see the 20-day SMA (Green Line), the 50-day SMA (Red Line) and 200-day SMA (White Line) are all trending up … however the price has broken below the 20-day, 50-day and 200-day SMA in the past couple of weeks. This could spell disaster … or if we look back two years to when it happened before in March 2020 … one could see Opportunity.
Today, may not be a good time to be holding this ETF – especially if you did not buy it until December 2021. But it could be a great time to be buying it – especially if you believe history is going to repeat itself and it will start trending up again shortly like it did in April 2020.
Also, you should notice that while the 20 and 50-day SMA is trending down … the 200-day SMA is still up for now.
Let’s remove the price and take a look at just the 20 and 50-day SMA to clean the chart up a bit.

Now let’s assume a person wanted to Swing Trade this asset based on the 20-day SMA crossing above or below the 50-day SMA. In other words, they would buy it when the green line (20-day SMA) crossed above the red line (50-day SMA) and sell it when the green line (20-day SMA) crossed below the red line (50-day SMA). In this case there would be five buys and sells between about April 27, 2020. How would that have worked out for them.
Here’s the actual transactions that would have occurred:

And this would be the investment graph:

Swing Trading with the 20/50 SMA moving average will not always make you money as you can see it the graphic below were I’ve added up and down arrows …

Here we see that you would have made money on three of the trades and would have lost money on two of them.
Of course, this is only using the 20/50-day SMAs. You could also consider using the 10/20-day SMAs, the 10/30-day SMAs, the 50/100-day SMAs or even the 50 or 100/200-day SMAs, depending on the time frame you are comfortable with and your overall investment objective. But in this case – overall – this would have been your results:
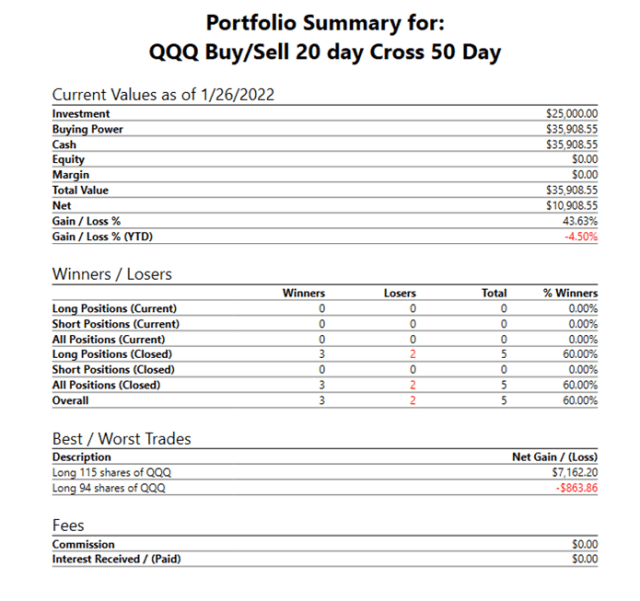
A 60%-win rate with a 43.63% gain in two years is not all that bad for paying attention and making a few swing trades based on moving averages. That is an average simple return on investment (ROI) of about 21.815% per year and the rule of 72 says at this continued rate we would double our investment every 3.3 years or so. And the great part is you will do this without a lot of draw down on invested capital because you would continue to close the investment each time the 20-day SMA (or whatever time you’re using) crosses the 50-day SMA (or whatever second time you’re using).
Now if you can stomach the drawdowns and sleep at night … then you may want to simply be a buy and hold investor. If you did this with the QQQ ETF this is what your results would look like today:

Now even I have to admit that a current return of 61.12% is better than a return of 43.63% – and buying and holding quality stocks or ETFs usually pays bigger gains in the long run. Like I’ve said many times … “time in the market is usually more important than timing the market and usually pays much better,” but you still have to be able to live with the fact that there are going to be bigger draw downs like you see in this chart just so far this year; where $46,403 at the beginning of the year is now only worth $40,280.05 for a draw down of $6,118 or 13.18%.
Summary:
Now you have another arrow to put into your quiver … Swing Trading using Moving Averages to go along with Swing Trading using Bollinger Bands.
You should never use just one technical indicator to decide on making a trade (Buying or Selling). Most swing traders suggest that you get familiar with many of them and use three or four that you’re comfortable with.
I will discuss more technical indicators in the coming weeks … for now I simply wish you a good future with your trading in and out of the markets that have become very volatile over the past 12 months.
Thank You,
Jerry Nix | Freewavemaker, LLC