
Tuesday, April 25, 2023 – By: Freewavemaker, LLC

When I first thought about writing this article today it struck me that I was not even sure what the largest ten companies were in America today was, so I decided to do some research. Here’s what I found out about the top ten companies based on size. Size means capitalization of the company. To find a companies capitalization rate you simply multiply the number of stock shares outstanding by the current price. At the time of this writing this is what I found:

Now what is interesting about this is that there are currently 8,000 public companies that trade on the US Stock Market today. These companies are listed on a variety of exchanges, including the New York Stock Exchange (NYSE), the Nasdaq Stock Market, and the NYSE American. The NYSE is the largest stock exchange in the world by market capitalization, and it lists over 2,500 companies. The Nasdaq is the second-largest stock exchange in the world by market capitalization, and it lists over 3,700 companies. The NYSE American is a smaller stock exchange that lists over 1,800 companies.
The market capitalization of the US Stock Market is the total value of all publicly traded companies in the United States. As of April 25, 2023, the market capitalization of the US Stock Market is $34.7 trillion.
It is interesting to note that the top ten companies in America today, makes up a total of 33.63% of the total market value. In other words, these ten companies are HUGE.
The question is … Can a person make money by investing in these big behemoths today? That is what I will try to show you in this article.
The next thing I did was go into my VectorVest software and build a table showing these stocks and several features about these stocks ranking them by VST (the Value, Safety and Timing rating) from highest to lowest. You can see that table below:
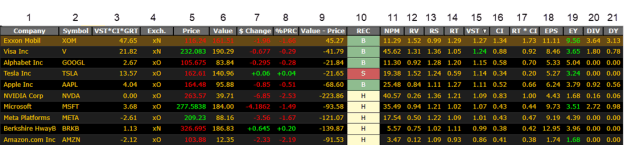
Column 15 is that VST Rating. But please take note of a few other columns here.
Column 9 is the Value of the company (per share) less the Price per share (Column 6 minus Column 4). Notice that only one of these stocks (Exxon Mobil) is currently under valued by a little more than $45 per share. The rest of the companies are overvalued, based on the way that VectorVest chooses to value stock. It is important to keep in mind that stock evaluation is much like real estate appraisal. Much of it is subjective and different analysts (appraisers in real estate) will come up with different values.
Notice also (Column 10) that as of today 4 of the stocks are rated a Buy, 5 are rated a Hold and 1 is rated a Sell. What I am suggesting (only for this article for education purposes) is that we BUY them all. Again, this is not a recommendation that you purchase anyone of these stocks today. I am sharing this for education purposes only to let you know the value of having a plan and following it.
Is time in the market really more valuable than timing of the market?
It may or may not be. It all depends on what your investment goals are, how smart (or lucky) you are, what type of money management (risk management) techniques you plan to use, and how much time you really want to spend doing research activity to be able to trade the market.
Personally, I like day trading … but I don’t day trade with all my money. I also like swing trading … but I don’t do that with all my money either. I also like the old-fashioned buy and hold trading … and again I don’t do that with all my money. However, buy and hold, is what I will be talking about in this article.
Now when I buy to hold investments that does not mean I don’t use certain money management techniques (sometimes called risk management or risk mitigation techniques).
For example, I may use stop loss orders so that I don’t have to ride BIG DIPS down too far. Or, I may use alerts to alert me to a dip in value so that I can buy more of the stock I’m holding (if I have capital available and decide it is a good place to invest more money). Or, finally, I may employee techniques to conserve gains (such as using options as insurance) once those gains hit a nice level of say 25% to 100%.
But today we are just going to strip away all the flashy stuff and do buy and hold investing from one month to 20 years so that you can really see the value of doing such.
A few things you need to know first:
Before beginning it is important to note that the average return on the stock market over the past 20 years has been 8.91%. This is according to the S&P 500, which is a basket of 500 large-cap US stocks. The S&P 500 has experienced a number of ups and downs over the past 20 years, including the dot-com crash of 2000 and the financial crisis of 2008. However, it has ultimately trended upwards, providing investors with a positive return over the long term. If we consider 30 years, the average return on the stock market in general over the past 30 years has been about 10% per year.
It is important to note that the past performance of the stock market is not necessarily indicative of future results. The stock market is a volatile investment, and there is always the risk of losing money. There is also a risk of losing money in Gold, Crypto Currency, Currency, Real Estate, Art and other investments as well. Investors should carefully consider their investment goals and risk tolerance before investing in the stock market, or any other investment medium.
Now with that being said, let’s take a look at the various time periods. The tables below the graphic of the portfolio will be rated from highest return to lowest return (second to last column on the right). Also, we are assuming that we split $20,000 as evenly as possible over the ten stocks referenced previously. Keep in mind these were the largest companies in America today, they ALL may not have been the largest companies in America 3, 5, 10 or even 20 years ago.
One month look back:

Here the highest earner was Exxon Mobil, which is no surprise considering that we are in the middle of a war with Ukraine and Russia with our dependence on the middle east for adequate oil, since the Biden Administration has just about brought the drilling for oil in this country to a halt and used up a lot of our oil reserves recently.
Over all, in one month these ten stocks (even though two lost substantial amounts) returned $456.36 on a $20,000 portfolio for a return of 2.32%. That would be equivalent to about 27.84% on an annualized basis – If it earned 2.32% every month – which it probably would not.
Three months look back:

Over the past three months the portfolio earned 15.35% or $3,070.68 on a starting amount of $20,000. This would be an annualized rate of return projected at 61.40%. The top return was 47.93% on Meta Platforms (aka Facebook) with the worst return being 3.02% on Exxon Mobil.
Six months look back:

Over the past 6 months this $20,000 portfolio would have grown to $23,979 (or by 19.90%). This would be an annualized projected return of 39.80%. The highest return over this period was Nvidia Corp with a return of close to 105% (more than double the amount invested), and the worst returns were Amazon and Tesla with losses of 9.87% and 27.46% respectively. If you look at the graphic above (3 months) which would have been the last half of this period you would see that both of these companies were up in value … which is why you probably do not want to get out of a company too soon in most cases.
One year look back:

We see that over the past one year the portfolio really did not have stellar performance. Over all the $20,000 only grew by $816.70 which was a one-year return of only 4.08%. Six of the holdings had positive returns (and four of those were very good) while 4 of the holdings actually lost quite a lot in value.
Three years look back:

Had you invested $20,000 in this portfolio 3 years ago you would have gained $19,353.15 in overall growth with 9 out of 10 holdings producing positive returns. This would be a total return of 96.77% or an average annual return of 32.2553% even with the lackluster returns over the past one year.
Notice that this portfolio of stocks would have almost doubled in value in 3 years.
Let’s talk about the rule of 72:
Thanks to napkinfinance.com here it is …

It is important to understand that they are talking about an annual compounded rate of return here and not a simple return. Keep in mind, the Rule of 72 is just an approximation. However, the Rule of 72 can be a helpful tool for estimating the potential returns of an investment. I know the above showed a return of 32.2553% but that was simply the total return of 96.77% divided by 3 years … which is not a compounded return (a return of interest on interest).
Using a financial calculator, the actual return you would need to double your investment in 3 years would be 25.9921%. Here’s the way a compounded return would look compared to a simple return:

For now, let’s move on.
Five years look back:

A $20,000 investment made five years ago would be worth $59,011.35 today for a gain of $39,011.35 (not including any dividends in any of these portfolios). That would be a percentage gain of 195.06% or an average annual return of 39.01% per year. You can see that over 5 years all holdings would have profited from 20% to over 755%.
Ten years look back:

Wow … over the past ten years (even with the Covid Debacle of 2021-2022) this $20,000 portfolio would have grown to $353,740 (after a number this big we can quit counting the cents). This would be a return over ten years of 1,668.70% or an average of 166.87% per year. Look at the difference between the return on NVDA and XOM (the ROI Column). All of this though for simply buying and holding and not even worrying about other income such as dividends – which some of these companies pay regularly.
Fifteen years look back:

The first thing you may notice here is that we’ve gone from 10 companies to just 8 companies. Why? Tesla, Inc. is missing as is Meta Platforms. In doing my research for the article I found that TSLA went public and started selling shares on 06/29/2010 and META when public and started selling shares on 05/18/2012. So, these stocks were not available on 04/25/2008. However, the portfolio of 8 stocks, had we invested $20,000 into them, would have returned $348,989 or about 1,644.95% over this 15-year period ending today. That is an average annual return of 109.66% per year which means you still could have doubled your money every year o average.
Finally, a Twenty year look back:

There was only 5 of todays top ten companies available for tracking beginning on 04/25/2003. It appears that Visa, Alphabet (Google) and Berkshire Hathaway B stocks are not shown. Alphabet Inc., formerly known as Google Inc., went public on August 19, 2004. Visa shares started trading on March 19, 2008. As for Berkshire Hathaway B shares … Berkshire Hathaway Class B shares began trading on May 20, 1996. They were created to make Berkshire Hathaway stock more affordable to small investors. Class B shares are worth one-thirtieth of a Class A share, and they have 1/10,000th of the voting rights of a Class A share. The reason they are not on the list above is because VectorVest did not start tracking the stock (and they currently track over 9,140 stocks) until 12/04/2006.
In any event $20,000 invested in these five of the top 10 stocks on 04/25/2003 would have grown to a whopping $4,043,994.61 over 20 years all while you set back and watched. The total return was 20,119.97% for an average of better than 1,005.99% per year.
Compare that for a 10% return per year over 30 years or 8.91% per year over the past 20 years, for the market in general, and I think you can see why many feel that “Time in the market is far better than trying to Time the market.”
Am I suggesting that you buy and hold these five or ten stocks?
No, not at all. What I am suggesting is that if you don’t have a knack for knowing exactly what to buy, when to buy it and what to sell and when to sell it … you may simply want to look for high quality, high value, companies that you are familiar with and buy them with the idea of holding on to them for a longer than normal term.
If you are really concerned about long-term market downturns then set up some exit strategies to get you out of these stocks based on logical facts before everything starts to “fall apart” and do not selling emotionally when things do seem to fall apart. We never know when the market is going on a long-term trend up or a long-term trend down … but either way if you’re wise and make logical decisions you can come across opportunities regardless of what the market is doing at the moment.
Now you may be thinking; “I’ve only got XX number of years before I retire, or I’m already retired, it’s to late for me.”
My response is, “It’s never too late to start and it’s never the perfect time to start. The main thing is that you start. Take that step and quit being pushed here and there.”
Good luck and let me know if I can help with more education. I cannot and will not offer investment advice now that I am no longer licensed to do so.
Most of all Remember: You can’t row the boat without “making waves” and if you are not rowing the boat you are likely only drifting where the currents take you!
One of your best. My problem is at age 77 I don’t have 20 years. Can u help with that problem
Jim, how do you know you don’t have 20 years. Willie Nelson just turned 90 and compare his lifestyle with yours! Also as I said in my closing … its never too late.to start. Quality companies bought and held for five years may do better than trying to time the market. Your best bet is to check with your financial advisor. In any event, thanks for reading my article.