
There is not much that I like better than putting together a watch list of stocks that I can track and eventually come up with some good investment ideas that I can take advantage of. Before going much further it is important that you understand the following facts:
- Hindsight is 20/20.
- There is no guarantee that past performance will be indicative of future performance.
- All investment decisions should not only be made by viewing what has happened in the past but also by what you believe can happen in the future.
- This article is meant for educational purposes only.
- If you decide to act on any of the investments discussed herein, I suggest that you do so at your own risk and if you have the luxury of having a financial advisor or advisors … discuss it with them first before making any investment decisions.
As a person working in the Financial Planning field for 42 years prior to my retirement I literally advised hundreds or perhaps thousands of people on how they should invest their money and income. One of the investments I would often recommend was an Exchange Traded Fund (ETF) known as, and commonly called, the Q’s.
The formal name is Invesco QQQ Trust and it has the stock/ticker symbol of QQQ. This is an Exchange Traded Fund incorporated the the USA and it’s goal is to track the performance of the NASDAQ 100 Stock Index. Do not confuse this with the NASDAQ Composite Index that is shown everyday on the news.
Going back 5 years, this chart shows the performance of both the Nasdaq 100 index (green line) and the NASDAQ Composite Index (red line).

As you can see in five years the NASDAQ Composite Index is up almost 100% while the Nasdaq 100 Index is up about 118% or so. In previous articles I’ve talked about the rule of 72.
The rule of 72:
- Divide 72 by the return received and the result will be the number of years it takes to double your money. Or,
- Divide 72 by the number of years it takes to double your money and the result will be the interest rate or growth rate you received each and every year on average.
So, 72 divided by 5 means that your return would have been about 14.40% to double your money. In this case the NASDAQ 100 was more than 100% and the NASDAQ Composite was just shy of 100%. However, as you can see (in the above graphic) … January 2016 and October to December 2018 and again in May 2019 … there would have been some downturns. However the overall results were actually this (shown in the graphic below) between February 20, 2015 and February 19, 2020:

The NASDAQ Composite returned 98.32% total or an average of 19.68% simple growth per year while the Nasdaq 100 returned 118.93% total for an average of 23.80% simple growth per year. This is not a compounded return. If you want a compounded annual return you would use a financial calculator and come up with the following …
- NASDAQ Composite = 14.676%
- Nasdaq 100 = 15.85%
This brings us back to the RULE of 72 as I stated above.
You will also notice at the bottom of the graphic above that the SPX (S&P 500 Index) during this time returned 60.68% total for an annual simple return of 12.14%. The annual compounded return here would have been 9.949%. You have also read in previous articles where many regular mutual funds (about 85% of them) cannot even match the S&P 500 return long-term. A major reason for this is that they are managed by humans who have the right to buy and sell as they see fit – and where humans are involved with this right – emotion takes over because if these human managers are not making progress their jobs could be on the line.
With index tracking ETFs these managers must stick to the index whether it ends up being positive or negative. No emotions can come into play.
What did QQQ do during this period of time?
Had you invested in the QQQ Exchange Traded Fund back on February 20, 2015 your investment would have grown from $108.41 per share to $237.16 per share as of February 19, 2020. This is a return of 118.76% or 23.77% simple per year. This would have been an average compounded rate of return of 16.948% annually.

That is just about as close to the Nasdaq 100 as a person can get. Let’s take a look at a chart of this over the past five years before moving on to the stocks that are inside of this fund.
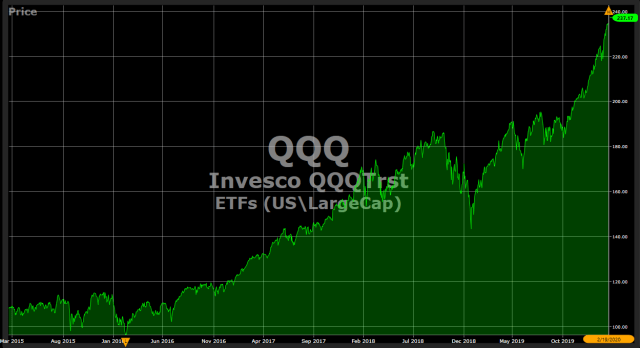
This means $10,000 invested five years ago would be worth about $21,829 today – more than double the amount invested.
So what is in this portfolio?
First of all it is important to understand that the portfolio of stocks held in QQQ is held in 7 of the 11 S&P Sectors. These 11 sectors include the following:
- Communication Services
- Consumer Discretionary
- Consumer Staples
- Energy
- Financials
- Health Care
- Industrials
- Materials
- Real Estate
- Technology
- Utilities
It is also important to understand that some of the sectors used (and some of the stock used) by the managers of the fund are more heavily weighted in terms of capital invested than others. For example … here’s the sectors currently held in QQQ as of this past September (and I don’t believe it has changed since then, except for potentially the weighting due to market changes).

Since the top three sectors based on asset weighting is Information Technology, Communication Services and Consumer Discretionary … this is probably the area I would begin to look for good stocks.
For a list of all the stock, sorted by sector, that can be found in this portfolio of stocks, click on this QQQ Link. This will bring up a list of 103 stocks you can begin to watch on your own at some point in the future – or now.
Now some of you know that I spend a lot of money each year/month on platforms that allow me to research and track stocks. You don’t have to be so extravagant with yours. A simple excel spreadsheet with daily updating by you could be beneficial. Or, if you want to spend some money on an add-in for excel to automate your portfolio/stock tracking consider this: https://marketxls.com/
Depending on what features you want in your tracking this could cost between $240 per year and $680 per year (about $20 to $57 per month). This is what the add-in for the spreadsheet would look like:

This would give you about everything you need … and no … I am not getting paid to recommend this add-in. I just wanted to let you know that this data-mining tool was available.
Past Performance per Sector
Another tool I use is Vectorvest, and while I am not suggesting it … there is a demo you could try that will cost very little for a few weeks while you decided if you want it. You can find information about this program here: www.vectorvest.com
As you review these past performance snapshots you may not see all the stocks listed in the portfolio in these lists simply because they were not available five years ago. However, this will give you some idea of how these stocks in these sectors would have performed. Keep in mind also … this is price performance only and does not give any indication or values of dividends that may have been paid by some of these companies.
Notice how these tables give you the number of winners, number of losers and the number of stocks that broke even, as well as the % price change and Total Annual Rate of Return (Total ARR). It also provides the average return of all stocks listed and compares it to the S&P 500. The Total ARR is not a compounded return but rather to total return divided by the number of years held (e.g. 215.07% after rounding divided by 5 years = 43.05% after rounding).
First up – Communication Services

- Annual Compounded Rate of return even with the losers = 18.311% per year.
Some of the companies listed will be very familiar to you … Facebook, Google, Netflix, etc.
Second Up – Consumer Discretionary

Here all 15 were winners. Again, you may recognize some of these companies from their ticker symbols … Tesla, Starbucks, Amazon to name a few.
- Annual Compounded Rate of return = 21.790% per year.
Third – Consumer Staples

There are some common household companies here as well … Monster Drinks, Pepsi and Walgreens. 1 Loss but still 80% were winners.
- Annual Compounded Rate of return with 1 loser = 7.08% per year.
We can see why there was not a lot of weight put here – but for a conservative investor … these stocks still could be beneficial. They tend to perform better in down markets.
Fourth – Health Care

Here there were 8 winners and 6 losers for a Win rate of only 57%. Unless you are well versed in Pharmaceuticals you may not know many of these … but some of them are Vertex Pharmaceuticals, Amgen Inc., and Gilead Science.
- Annual Compounded Rate of return with 6 losers = 8.049% per year.
Fifth – Industrials

Here we find companies like Fastenal, CSX Rail Services, United Airlines and American Airlines.
- Annual Compounded Rate of return with 1 loser = 21.94% per year.
Sixth – Information Technology
There were 38 Stocks listed here and I could not capture them all on one screen shot so I had to break them in half. I will show 19 in the first screen shot and 19 in the second screen shot then combine the returns below them.


- % Price Change = 224.36%
- Total ARR = 44.90%
- Annual Compounded Rate of return with 1 loser = 20.64% per year.
You should recognize a lot of these companies but some of the more popular ones are Adobe, Nvidia, Microsoft, Apple, and Cisco.
Seven – Utilities and other

The other that showed up in the portfolio was WLTW which is actually in the Financials Sector though the managers of the fund showed it in another sector. I threw it in here since the return was between the two utilities shown.
- Annual Compounded Rate of return = 11.19% per year
Past Performance of All Stocks …
If you would have had enough money (say $100,000) to purchase shares of these 99 stocks that were available and tracked by Vectorvest on 02/20/2015 this is how your portfolio would have performed.

Yes, $100,000 would have grown to $247,594 for a total return of 147.59%. On an annual compounded basis that would be a return of 19.88% per year – doubling your money every 3.62 years approximately.
However, had you purchased only the 45 stocks that had a buy recommendation from Vectorvest at the time and held them for the five year period this is what the portfolio would look like between then and now.

The $100,000 would have grown to $263,805 bringing your return to 163.90% or a 21.41% per year – meaning a doubling of the money every 3.363 years.
What would have happened had you decided to purchase the top stock in each sector. Vectorvest does not use the same 11 sectors found in the S&P 500. They break them down even further. Here’s a list of the sectors found in this list of stocks per Vectorvest:
- Auto & Truck
- Business Services
- Computer
- Drug
- Electronic
- Food
- Healthcare
- Insurance
- Internet
- Leisure
- Media
- Retail
- Software
- Telecom
- Transportation
- Utility
They rate their Value, Safety and Timing ranking (VST) on a scale of 0 to 2.
So, had you decided to purchase the top stock in each sector based on VST back in February 2015 … this is what your portfolio would look like:
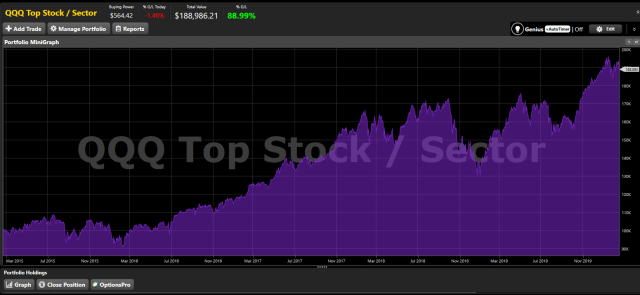
This would not be too good. A return of just 88.99% means you would net an annual return (compounded annually) of just 13.57% per year, but there were a couple of periods of huge draw downs vs. only one period in the two graphs above this one. It would take 5.3 years to double your money.
When investing in individual stocks it is important to set up criteria that will get you out of the stock when the stock begins to perform in a negative manner. I will write another article about this in the future … but for now simply consider setting a stop-loss order on the stock. This will assure you that you are able to close out the stock when it starts to trend down (which they all do from time to time). However, you will not want to set this stop loss so tight that a minor correction or a little bad news takes you out only to see the stock explode back up in value a day or two later.
But what if you don’t want to manage the individual stock holdings?
Then you may consider discussing with your financial advisor the viability of simply buying the QQQ ETF. This is how this would have looked had you done this in February 2015:

This would allow your $100,000 to grow to $213,761 which means you would still net an overall return of 113.76% or an average annual compounded return of 16.41% per year. Your money would double every 4.388 years. At this rate the $100,000 would grow to $1,000,000 in a period of just 16 years. To see how this growth can accumulate see the table below:
| Beginning Value | Ending Value | Years | Total Years |
| $100,000.00 | $213,761.00 | 4.388 | 4.388 |
| $213,761.00 | $427,522.00 | 4.388 | 8.776 |
| $427,522.00 | $855,044.00 | 4.388 | 13.164 |
| $855,044.00 | $1,710,088.00 | 4.388 | 17.552 |
$1,710,088 would provide a nice retirement income at 5% per year of about $85504 per year or $7,125 per month and you would never touch the $1.7 million dollar nest egg.
Should you have any questions, please feel free to leave them in the comments section below or reach out to me at freewavemaker@gmail.com if you have a private question or concern.
Until next time, good investing and Make some Investment Waves,
Jerry Nix | Freewavemaker, LLC