

Jerome Powell (Federal Reserve Chairman) and Joe Biden (U. S. President) really do not care about Americans on “Main Street” when in comes to the economy and the stock market. They must not realize that much of the stock market is made up with individuals who invest in 401(k) plans and other pension plans. It does not matter to them that they are breaking the banks of many Americans who are working to make ends meet. As long as it pays off for the elite in long-run they are happy. In a recent news conference President Joe Biden made the statement when asked about the economy, “I don’t care what happens in the stock market …” He should care since many who voted him into office has money invested there.
For much of this year the stock market has been trending south with lower highs and lower lows. Take a look at the following Year-to date Chart of the S&P 500 (SPX) index

Considering the index started this year at 4,778 points and is now at 3,647 points means the average investor is likely down 23.67% on their investments or pension plans if they were fully invested into the stock market with no positions in bonds or cash. This is not good for many, especially those retired or close to becoming retired. But does our Fed Chair or President really care? As I said before, the answer must be NO since it seems they are doing very little to stop the bleeding in the market. In fact, with their actions and rhetoric they are causing the markets to bleed even more.
There are even some Guru’s or Prognosticators that are now predicting another 2007-2009 like decline in the stock markets. Let’s review what happened back then for those that are too young to remember it.
I will show you three graphs that are from October 11, 2007 through March 6, 2009 thanks to a website I use often (www.stockcharts.com). This is one of the longest BEAR markets we faced in recent history.

The mighty DOW went from a high of 14,079 on to a low of 6,627 during this 18-month period. That is a loss in value of approximately 53% (rounding to the nearest whole number)

The index used by many to determine what the overall market is doing, the S&P 500 Index, dropped from 1,565 points to 683 points in this 18-month period. That is a loss in value of approximately 56% (again rounding to the nearest whole number).

This index which is made up of mostly technology stocks dropped from a value of 2,188 points to a value of just 1,065 points during this 19-month period. That is a loss in value of approximately 51% (again rounding to the nearest whole number).
It’s safe to say that had you been in the market during that 18 month period (and I was) then you likely lost 50% of your investment portfolio from start to end of the period. It did not have to be that way, but if you’re like most it likely was.
Are we headed for another long-term bear market? I can’t tell you that for sure … only time will tell. We may be at the bottom now and the next leg could be upward bound – though many are expecting that there will be multiple up swings and downswings until the Fed gets inflation under control (if they do) and more downward movement could be ahead. I can assure you that nobody knows for sure what is going to happen tomorrow, next week, next month or next year.
I can tell you that Long-term the market will continue to trend higher – as it has in the past – but over the short-term you should anticipate more lows. There is an old saying that I use in my investment plan and that is simply this:
Always Expect the best, always Anticipate the worst and by all means always Capitalize on whatever comes your way!
I have learned, though not always applied, simple principles that will allow a person to make money in the market regardless if it is going higher or lower.
How can you invest when the market is going down, as it has been doing all year, and still make money?
You could be like the “Elite” and learn to sell stock short. In other words, sell today at a relatively higher price in anticipation as the market falls the price of the stock you sold will go down and you can buy it back later for a lower price and keep the difference in your account. For example:
You sell a stock you do not own (selling short) for a price of $30 per share. If you did this on 1,000 shares of the stock your account will be credited with $30,000. Later when the stock drops to say $15 per share you buy it back, spending $15,000 of the cash you were paid when you sold it, and keep the additional $15 per share that you have left in the account (or $15,000). To do this you literally borrow the stock from your broker to sell it … and pay the broker back the stock when you buy it back. In this example your Return on Investment (ROI) would be 100%.
For many this is too complicated and there is an easier way …
Investing in Contra ETFs:
Contra ETFs are also known as Inverse ETFs. ETF stands for Exchange Traded Fund and they are much like mutual funds (a portfolio of holdings) but they are bought and sold like individual stocks. Some of these ETFs are meant to track Indexes and some are meant to track entire sectors or industry groups. For the purpose of this article I am going to focus on Index ETFs – More Specifically Inverse or Contra Index ETFs.
For simplistic purposes let’s take a look first at what the S&P 500 Index has done over the past one year.

Had you invested in the S&P 500 index (and you can do this with an ETF known as the SPDR S&P 500 Index ETF – SPY) the Red Line shows you would have lost about 18% of the capital you invested a year ago.
Now let’s assume you had the almighty “Crystal Ball” and knew that the S&P 500 would deliver lower highs and lowers lows (a typical bear market trend) and invested your money into the ProShares Short S&P 500 ETF (SH). This is what would have happened:
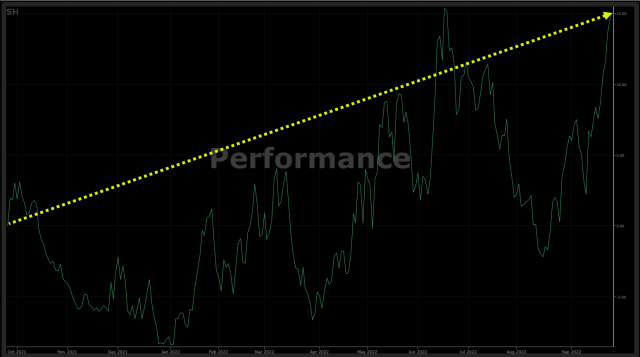
Here we see the green line over the past one year shows higher highs and higher lows (a typical bull market scenario) and you would have ended up making about 15% on your money all while the stock market was actually going down.
Now let’s combine the two graphs and you will see exactly what I mean. Remember the Red Line is the S&P 500 and the Green Line is the Contra/Inverse Fund of the S&P 500 Index.

Notice that when the red line is going down the green line is going up and when the green line is going down the red line is going up. Of course it would not do much good to put equal dollars into each of these at the same time since that would not earn you, or lose you, a lot of money over the long haul. That would be like betting $2.00 on every horse in the Kentucky Derby.
In addition to ETFs that go inverse 1:1 … there are also inverse ETFs that go inverse the index 2:1 and 3:1. In other words you could purchase a DOW Jones Industrial Average Contra Fund that would give you a return of +1% if the Dow lost 1% … or a return of +2% if the Dow lost 1% … or even a return of +3% if the Dow were to lose 1%.
Here’s the danger … it works the same way in the opposite direction:
If the Dow were to gain 1% you could lose 1%, 2% or 3% depending on the Contra fund you hold.
It should also be noted that there are funds that work the same way if the market is headed up. For Example:
- If you had say the NASDAQ 100 ETF (QQQ) if the Nasdaq 100 went up 1% your fund would go up 1%.
- But if you had the 200% NASDAQ 100 ETF (QLD) for each 1% the Index went up the fund would go up 2%.
- Or if you had the 3X NASDAQ 100 ETF (TQQQ) for each 1% the Index went up the fund would go up 3%.
In order to make money with these highly leveraged ETFs (1X, 2X or 3X return) it is imperative to have some idea as to which way the market is headed before investing … as well as knowing when to take gains or cut losses (AKA an Exit Plan) before investing. That is a subject for a different article.
Let’s move on with Making Money Contra Style.
Past Performance in Contra ETFs:
Let’s look at the performance from about February 19, 2020 through March 23, 2020 – a period when many (because of COVID-19) thought the world was surely ending. Take a look at this chart of the S&P 500 for the 2020 Calendar Year!

President Trump was in charge (holding the FED at bay) and everyone thought the market could only continue to go sky high … then COVID raised it’s ugly head … THANKS CHINA!!! A pandemic was called in late February and over the next month the market cratered. Let’s see what would have happened if you held the REGUALR Index ETFs as compared to the 1x and 3x Contra Index ETFs.
The Dow Jones Industrial Average
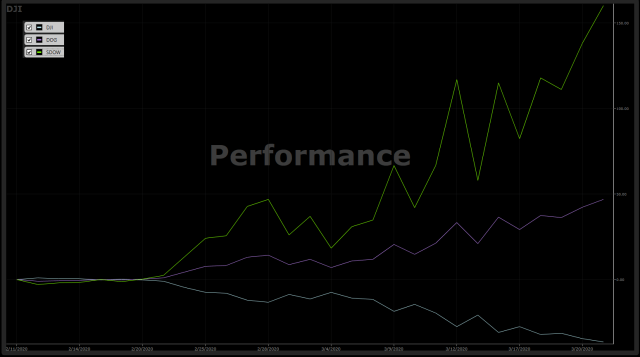
During this month …
- The Dow lost 35% – light blue line
- The 1x Contra Dow (DOG) would have made you 47% – purple line
- The 3x Contra Dow (SDOW) would have made you 160% – green line
The S&P 500

During this month …
- The S&P would have lost you 33% – red line
- The S&P 1x Contra Fund (SH) would have made you 41% – green line
- The S&P 3x Contra Fund (SPXU) would have made you 135% – white line
The NASDAQ 100 Index

During this month …
- The NASDAQ 100 would have lost you 26% – orange line
- The 1X NASDAQ 100 Contra Fund (PSQ) would have made you 27% – white line
- The 3X NASDAQ 100 Contra Fund (SQQQ) would have made you 73% – red line
The Russell 2000 Small Cap Index

During this month …
- The Russell 2000 index lost 40% – blue line
- The Russell 2000 1x Contra Fund (RWM) made 54% – purple line
- The Russell 2000 3x Contra Fund (SRTY) made 192% – white line
As you can see, these Contra ETFs can provide some pretty good money making opportunities if managed correctly.
Now let’s go back to the Great Recession of 2008:
From 10/11/2007 through 03/06/2009 had you been in the market (the S&P 500) you would have lost about 56.04%. However had you invested evenly into the 1X Contra Index Funds (the Dow, the S&P, the NASDAQ and the Russell Small Cap) you would have made 51.04% on your money as shown below:

A rhetorical question … Would you be happier making 51% or losing 56% over about 18 months?
Had you invested into the 2x Contra Funds (3x Funds were not available then) you would have made about 95.68% on your money as you can see below vs. a loss of 56.04% in the market:

WARNING: Past Performance is not indicative of future performance. Any investments can lose you money and may not perform in the future as they have in the past.
How about during the COVID Crash?
Using the 1X funds for a little more than a month … a gain of 42.45% vs. a loss of 33.37% as shown below:

Or, using the 3x funds for a little more than a month – how about a gain of 140% as shown below:

Don’t forget to take a look at the annualized returns in the top two tables … 378% and 1,248% – WOW!
How well does this work with say Industry or Sector Funds?
On August 31, I invested $10,000 into a paper trading account and purchased 5 Contra ETFs as shown below with about $2,000 (as close as possible) in each. I set a 10% trailing stop loss on these to cut losses quickly and efficiently. Here’s my trade journal:

Notice that LABD got sold on 09/02/2022 (just 3 days after it was purchased) and it was replaced with TECS.
Here is what the portfolio looked like as of close of business yesterday, 09/26/2022:

You have to admit a 37% gain is not shabby during a period where the S&P is down 7.5%. the DOW is down 7.1%, the NASDAQ 100 is down 8.3% and the Russell 2000 is down 10.2%:

A major warning before jumping in:
These kinds of ETFs are very volatile and can change prices rather quickly. You should never invest more than you can afford to lose … and even then have some risk mitigation rules in place. On these kinds of investments I use …
- A 10% trailing Stop Loss initially. As the investment goes up in value I may increase my stop loss, and eventually get to a point where I will never give up more than 50% of my gains.
- For Example: If my gain gets to say 30% I may move my stop loss to 15%, or at 40% gain may move my stop loss to 20%.
- When an investment is sold and the market is still moving in the same direction (in this case down) replace it immediately with another investment of the same direction to keep diversification in your account.
- It it appears that the market is changing course and direction it may be a good time to look at changing to the opposite directional ETF. For example if you held SQQQ (the 3X NASDAQ 100 Inverse ETF, you might opt to replace it with TQQQ which is the 3X Regular way NASDAQ 100 ETF. However, be sure the market has changed direction. One or two days of green bars on a graph is not a new trend in most cases.
- When you are sure the market has changed direction and is headed up for a time and not down … it is recommended that you get out of all Contra ETFs and move forward with Regular ETFs or stocks that you expect to go up in value.
So how do you know when the market is going up and when it is going down?
The best thing to do, though it can become pricey, is to subscribe to an internet investment service. I use several, but the best for market timing (in my opinion) is VectorVest. They have several market timing systems depending on if your are a Speculative, Aggressive, Prudent or Conservative Investor that you could start paying attention to.
Another thing you could do is start watching certain technical indicators. I will not go into all of them here, though I will mention one. Before getting into this remember that technical indicators look at the past performance. There is no “crystal ball” out there that can look at future performance and tell you which way the market is heading (though there are some algorithms being used in some trading robots and software that is getting close) . So, you need to look at more than one technical indicator – and even then there is no guarantee you will get it right 100% of the time. Even the Robots do not get it right 100% of the time.
Relative Strength Index (RSI):
The next three paragraphs come from Investopedia.com
The relative strength index (RSI) is a momentum indicator used in technical analysis. RSI measures the speed and magnitude of a security’s recent price changes to evaluate overvalued or undervalued conditions in the price of that security.
The RSI is displayed as an oscillator (a line graph) on a scale of zero to 100. The indicator was developed by J. Welles Wilder Jr. and introduced in his seminal 1978 book, New Concepts in Technical Trading Systems.
The RSI can do more than point to overbought and oversold securities. It can also indicate securities that may be primed for a trend reversal or corrective pullback in price. It can signal when to buy and sell. Traditionally, an RSI reading of 70 or above indicates an overbought situation. A reading of 30 or below indicates an oversold condition.
Lets’ take a look at a graph of the S&P 500 along with the RSI:

The above is the past one year on the S&P 500 Index. The white line at the bottom is the 10 day RSI that I have set for indexes. The two yellow dashed lines are the 30 and 70 that was mentioned above. Notice the green circles I have drawn. This indicates the index is over-sold and may soon reverse trend to go higher. Compare that with the Bar Chart above (same graphic). The red circles indicate the index has been over-bought and may soon reverse trend to go lower.
If you were investing in Contra and Regular ETFs on the S&P 500 you would probably want to buy the Regular ETFs when the white line starts to move upward through the green circle. You would sell that ETF when the white line broke above 70 and consider using the Contra (Inverse) ETF at that point.
So is now a good time to get into Contra ETFs?
Perhaps for a few days or maybe even a week or two … but be careful.
There is one belief out there that October is a “Bear Market Killer.” This means October has been the one month per year (especially in a mid-term election year) to turn the markets from Bearish to Bullish. Before getting into October it is important to remember two facts about the market.
First, the fall down is always faster than the climb back up. This is simply mathematical. If you lose 5% in the market you must gain 5.26% to get back to even. If you lose 50% in the market you must gain 100% to get back to even. And, if you lose 90% in the market you must gain 900% to get back to even. Mathematical, you see?
Second, Bear Markets are generally shorter in duration than Bull Markets. The average length of a bear market is 289 days, or about 9.6 months. That’s significantly shorter than the average length of a bull market, which is 991 days or 2.7 years.
NOW FOR OCTOBER …
According to Jeff HIrsch.Tumblr.com …

October can evoke fear on Wall Street as memories are stirred of crashes in 1929, 1987, the 554-point DJIA drop on October 27, 1987, back-to-back massacres in 1978 and 1979, Friday the 13th in 1989 and the 733-point DJIA drop on October 15, 2008. During the week ending October 10, 2008, DJIA lost 1,874.19 points (18.2%), the worst weekly decline, in percentage terms, in our database going back to 1901. The term “Octoberphobia” has been used to describe the phenomenon of major market drops occurring during the month. Market calamities can become a self-fulfilling prophecy, so stay on the lookout and don’t get whipsawed if it happens.
October has also been a turnaround month—a “bear killer” if you will. Twelve post-WWII bear markets have ended in October: 1946, 1957, 1960, 1962, 1966, 1974, 1987, 1990, 1998, 2001, 2002 and 2011 (S&P 500 declined 19.4%). Seven of these years were midterm bottoms.

DOES THIS MEAN WE COULD SEE BETTER TIMES STARTING THIS OCTOBER? Not necessarily, but there is likely a strong possibility. So, if you are going to get involved in Contra/Inverse ETFs this late in the game, be prepared to get out quickly and have a list of things you want to invest into during a rising market in case the market shifts in the next 30 days or so since today is now 09/28/2022 as I write this.
In Conclusion:
I do hope that you have been able to gain some insight out of this article as to at least one way you can make money when the market seems to be going down. I am open to any comments you wish to make in the comment section of this article. I don’t have all the answers, but I am convinced the really wealthy do not get out of the market at the all time high … sit on the sidelines waiting for the market to drop down to lows before getting back in and doing it all over again. True investing is not sitting on the sidelines waiting for things to happen. True investing is taking advantage of opportunities that are always happening around you – Expecting the best, Anticipating the worst and Capitalizing on whatever comes your way!
Have a great investing future,
Jerry Nix | Owner, Freewavemaker, LLC